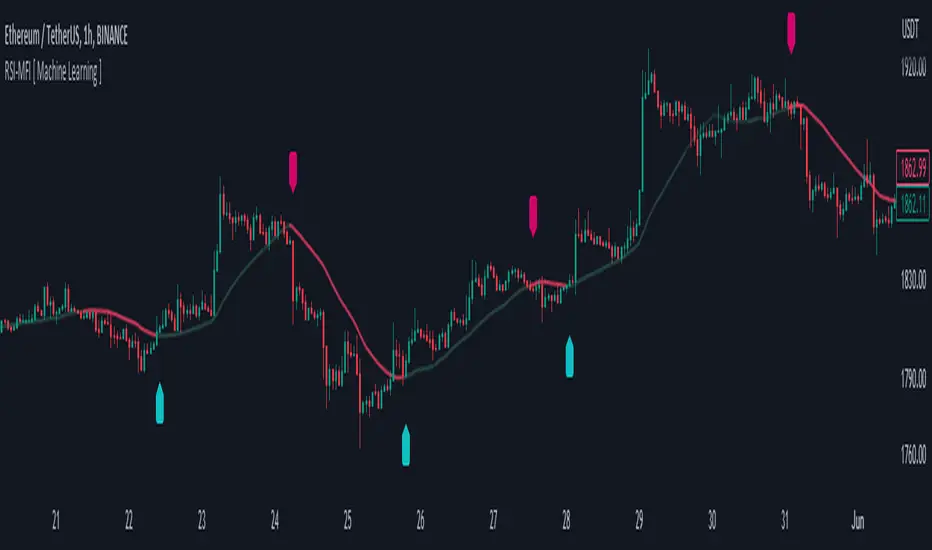
RSI-MFI Machine Learning [ Manhattan distance ]The RSI-MFI Machine Learning Indicator is a technical analysis tool that combines the Relative Strength Index (RSI) and Money Flow Index (MFI) indicators with the Manhattan distance metric.
It aims to provide insights into potential trade setups by leveraging machine learning principles and calculating distances between current and historical data points.
The indicator starts by calculating the RSI and MFI values based on the specified periods for each indicator.
The RSI measures the strength and speed of price movements, while the MFI evaluates the inflow and outflow of money in the market.
By combining these two indicators, the indicator captures both price momentum and money flow dynamics.
To apply machine learning principles , the indicator utilizes the Manhattan distance metric to quantify the similarity or dissimilarity between different data points.
The Manhattan distance is calculated by taking the absolute differences between corresponding RSI and MFI values of the current point and historical points.
Next, the indicator determines the nearest neighbors based on the calculated Manhattan distances.
The number of nearest neighbors is determined by the square root of the specified count of neighbors.
By identifying similar patterns and behaviors in the historical data, the indicator aims to uncover potential trade opportunities.
Trade signals are generated based on the calculated distances. The indicator compares each distance with the maximum distance encountered so far.
If a new maximum distance is found, it updates the value and considers the corresponding direction as a potential trade signal. The trade signals are stored in an array for further analysis.
Furthermore, the indicator considers the price action and a calculated regression line to differentiate between long and short trade signals.
Long trade signals are identified when the closing price is above the regression line, indicating a potentially bullish setup.
Short trade signals are identified when the closing price is below the regression line, indicating a potentially bearish setup.
The RSI-MFI Machine Learning Indicator visualizes the regression line on the price chart and labels the bars accordingly. It highlights the regression line with different colors based on the trade signals, making it easier for traders to identify potential entry or exit points.
Traders can use the RSI-MFI Machine Learning Indicator as a tool to analyze price movements, evaluate market conditions based on RSI and MFI, leverage machine learning concepts to find similar patterns, and make informed trading decisions.
"Relative Strength Index (RSI) " için komut dosyalarını ara
RSIOMA with Volume Index ConfirmationThis indicator is called "RSIOMA with Volume Index Confirmation". It is a technical analysis tool that plots buy and sell signals on a chart based on the Relative Strength Index (RSI) and the Negative Volume Index (NVI) and Positive Volume Index (PVI) indicators.
The indicator has the following input parameters:
- RSI Length: determines the number of periods used to calculate the RSI. Default value is 14.
- Overbought Level: determines the RSI level at which a security is considered overbought. Default value is 70.
- Oversold Level: determines the RSI level at which a security is considered oversold. Default value is 30.
- NVI Length: determines the number of periods used to calculate the Negative Volume Index. Default value is 255.
- PVI Length: determines the number of periods used to calculate the Positive Volume Index. Default value is 255.
The indicator calculates the RSI using the RSI Length input parameter and the close price of the security. It also calculates the NVI and PVI by looping through the volume data and the close price data of the security over the specified periods.
The indicator then uses the RSI, NVI, and PVI to determine buy and sell signals. A bearish divergence signal is generated when the RSI from one period ago is greater than the Overbought Level, the current RSI is less than the Overbought Level, and the close price from one period ago is greater than the current close price. A bullish divergence signal is generated when the RSI from one period ago is less than the Oversold Level, the current RSI is greater than the Oversold Level, and the close price from one period ago is less than the current close price. A sell signal is generated when a bearish divergence signal occurs and the current NVI is less than the previous NVI value. A buy signal is generated when a bullish divergence signal occurs and the current PVI is greater than the previous PVI value.
The indicator plots the buy and sell signals on the chart as green and red triangles, respectively. The "overlay=true" parameter in the indicator function indicates that the signals are plotted on top of the security's price chart.

Cutlers RSICutlers' RSI is a variation of the original RSI Developed by Welles Wilder.
This variation uses a simple moving average instead of an exponetial.
Since a simple moving average is used by this variation, a longer length tends to give better results compared to a shorter length.
CALCULATION
Step1: Calculating the Gains and Losses within the chosen period.
Step2: Calculating the simple moving averages of gains and losses.
Step3: Calculating Cutler’s Relative Strength (RS). Calculated using the following:
-> Cutler’s RS = SMA(gains,length) / SMA(losses,length)
Step 4: Calculating the Cutler’s Relative Strength Index (RSI). Calculated used the following:
-> RSI = 100 —
I have added some signals and filtering options with moving averages:
Trend OB/OS: Uptrend after above Overbought Level. Downtrend after below Oversold Level.
OB/OS: When above Overbought, or below oversold
50-Cross: Above 50 line is uptrend, below is downtrend
Direction: Moving up or down
RSI vs MA: RSI above MA is an uptrend, RSI below MA is a downtrend
The signals I added are just some potential ideas, always backtest your own strategies.

MFI + Realtime DivergencesMoney Flow Index (MFI) + Realtime Divergences + Alerts
This version of the MFI indicator adds the following 5 additional features to the stock MFI:
- Optional divergence lines drawn directly onto the oscillator in realtime.
- Configurable alerts to notify you when divergences occur.
- Configurable lookback periods to fine tune the divergences drawn in order to suit different trading styles and timeframes, including the ability to enable automatic adjustment of pivot period per chart timeframe.
- Background colouring option to indicate when the MFI oscillator has crossed above or below its centerline, or optionally when both the MFI has crossed its centerline and an external oscillator, which can be linked via the settings, has also crossed its centerline.
- Alternate timeframe feature allows you to configure the oscillator to use data from a different timeframe than the chart it is loaded on.
This indicator adds additional features onto the standard MFI , whose core calculations remain unchanged. Namely the configurable option to automatically, quickly and clearly draw divergence lines onto the oscillator for you as they occur in realtime. It also has the addition of unique alerts, so you can be notified when divergences occur without spending all day watching the charts. Furthermore, this version of the TSI comes with configurable lookback periods, which can be configured in order to adjust the sensitivity of the divergences, in order to suit shorter or higher timeframe trading approaches.
What is the Money Flow Index ( MFI )?
Investopedia describes the True Strength Indicator as follows:
“The Money Flow Index ( MFI ) is a technical oscillator that uses price and volume data for identifying overbought or oversold signals in an asset. It can also be used to spot divergences which warn of a trend change in price. The oscillator moves between 0 and 100.
Unlike conventional oscillators such as the Relative Strength Index ( RSI ), the Money Flow Index incorporates both price and volume data, as opposed to just price. For this reason, some analysts call MFI the volume-weighted RSI .”
What are divergences?
Divergence is when the price of an asset is moving in the opposite direction of a technical indicator, such as an oscillator, or is moving contrary to other data. Divergence warns that the current price trend may be weakening, and in some cases may lead to the price changing direction.
There are 4 main types of divergence, which are split into 2 categories;
regular divergences and hidden divergences. Regular divergences indicate possible trend reversals, and hidden divergences indicate possible trend continuation.
Regular bullish divergence: An indication of a potential trend reversal, from the current downtrend, to an uptrend.
Regular bearish divergence: An indication of a potential trend reversal, from the current uptrend, to a downtrend.
Hidden bullish divergence: An indication of a potential uptrend continuation.
Hidden bearish divergence: An indication of a potential downtrend continuation.
Setting alerts.
With this indicator you can set alerts to notify you when any/all of the above types of divergences occur, on any chart timeframe you choose.
Configurable pivot periods.
You can adjust the default pivot periods to suit your prefered trading style and timeframe. If you like to trade a shorter time frame, lowering the default lookback values will make the divergences drawn more sensitive to short term price action.
How do traders use divergences in their trading?
A divergence is considered a leading indicator in technical analysis , meaning it has the ability to indicate a potential price move in the short term future.
Hidden bullish and hidden bearish divergences, which indicate a potential continuation of the current trend are sometimes considered a good place for traders to begin, since trend continuation occurs more frequently than reversals, or trend changes.
When trading regular bullish divergences and regular bearish divergences, which are indications of a trend reversal, the probability of it doing so may increase when these occur at a strong support or resistance level . A common mistake new traders make is to get into a regular divergence trade too early, assuming it will immediately reverse, but these can continue to form for some time before the trend eventually changes, by using forms of support or resistance as an added confluence, such as when price reaches a moving average, the success rate when trading these patterns may increase.
Typically, traders will manually draw lines across the swing highs and swing lows of both the price chart and the oscillator to see whether they appear to present a divergence, this indicator will draw them for you, quickly and clearly, and can notify you when they occur.
Disclaimer: This script includes code from the stock MFI by Tradingview as well as the Divergence for Many Indicators v4 by LonesomeTheBlue.

[jav] HeikinAshized OscillatorsThis script allows to HeikinAshize different commonly used centered oscillators.
It plots them like Heikin Ashi candles. In this way, we can eliminate some of the noise and uncertainty that is inherent to applying only one calculation period to the oscillators.
Applying Heikin Ashi to an oscillator might be advantageous compared to applying it directly to the chart, because you are not altering price readings. The obvious advantage is the clear visualization of the trend directions without noise.
INPUTS
The oscillators included are:
Relative Strength Index (RSI)
Stochastic
Stochastic RSI
Fisher transform
Inverse Fisher Transform of RSI (IFTRSI)
Commodity Channel Index (CCI)
Money Flow Index (MFI)
Chande Momentum Oscillator (CMO)
Momentum (MOM)
True Strength Index (TSI)
Williams' Percent Range (WPR).
Apart from the choice of one of these indicators, only two more inputs are required:
the main (median) period and
the % of variability of this period.
RESULTS
The script calculates 4 evenly spaced periods from that data (period and variability), e.g. for a period of 50 and a variability of 30%, the script calculates oscillator values for 4 different periods evenly spaced around 50, (35, 45, 55, 65) and uses these 4 values to draw the Heikin Ashi candle.
The script also plots the usual upper/lower (overbought/oversold) values, as well as the central line.
CREDITS
The interesting concept of applying Heikin Ashi to an oscillator was recently introduced in Tradingview by @JayRogers . Many thanks for the idea.
For Heikin Ashi calculations, the useful script by @allanster was taken as a reference.
Any improvements, modifications or suggestions are welcome.

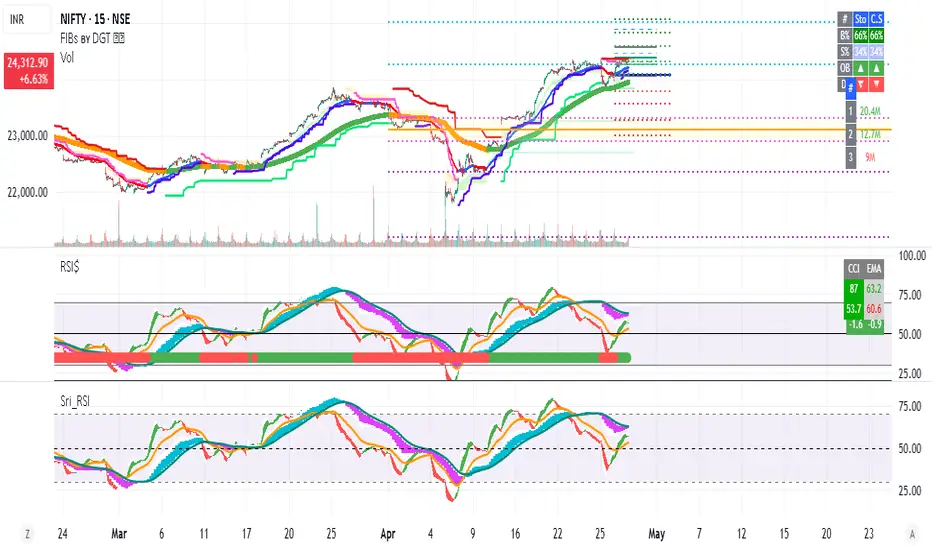
Table: Relative Strength Index (Multiple Timeframes) DESCRIPTION
It is the most popular and dependent Indicator, Relative Strength Index (RSI) . Now, I put inside a table to view chart momentum from Multiple timeframes.
This indicator tells different Timeframe (30 minutes, 1 hour, 4 hour, 1 day, 1 week, 1 month) of RSI value within table form.
HOW TO USE
Can consider a Long position when all timeframes go oversold while Short position when all timeframes go overbought. Alarm function is available. It sounds as all timeframes are overbought or oversold.
Modified The source of indicator from ©BeeHolder named "Performance"

Traders Dynamic Index Indicator Alert v0.1 by JustUncleLThis is a trend trading indicator+alert utilising the Traders Dynamic Index (TDI), Price Action Channel (PAC) and Heikin Ashi candles.
About 6months ago I came across the use of TDI in "E.A.S.Y. Method" that I found in forexfactory forums: www.forexfactory.com
and I was able to set up a chart based on the specifications by using Kurbelklaus scripts. However, I found that the alerts were being generated one or two bars too late, so at that time I was not successful using it with Binary Options. A few months later I found a variation of the method in the forecfactory forums which is able to generate the alerts a bit earlier, so this indicator is a modification of that early detection version.
The indicator can optionally use Heikin Ashi candles only for all it's calculation. I would recommend viewing the chart with Heikin Ashi candles, these smooth out the trends and makes trends very clear.
I found that this method it works good with most currency pairs or commodities and with 5min+ timeframe charts. I would suggest expiry of 2 to 6 candles.
ALERT GENERATION:
=================
The TDI (Traders Dynamic Index)
---------------------------------------------
Volatility Band VB(34), color: Blue, buffer: UpZone, DnZone
Relative Strength Index RSI(13)
RSI PRICE LINE (2), color: Green, buffer: mab
RSI TRADE SIGNAL LINE (7), color: Red, buffer: mbb
MARKET BASE LINE MID VB(34), color: Orange, buffer: mid
Indicator SignalLevels:
-------------------------------
RSI_OversoldLevel : 22 (normally: 32)
RSI_OverboughtLevel : 78 (normally: 68)
Alert Conditions:
-----------------------
Strong Buy : yellow
Medium Buy : aqua
Weak Buy : blue
Strong Sell : fuchsia
Medium Sell : purple
Weak Sell : black
Hints on How to use:
----------------------------
- When a Medium or Strong alert is generated and MACD histogram colour matches the direction
of the alert (optional auto filter), then place trade in direction of alert candle and MACD.
- I use the multi-Hull MA's for overall trend direction confirmation.
- Best positions normally occur near the MACD(5,15,1) Histogram crossing the zero line.
- The optional coloured Dots along the bottom of the indicator represent the first alert
of this type that was generated in this sequence.
- It is advisable to trade in the direction of the main trend as indicated the HULL MA red cloud:
if red cloud underneath PAC then BULLISH trend, if red cloud above PAC then BEARISH trend.
- Selecting the HeiKin Ashi candles does affect the MACD and MA caculations, so if you select
normal candles the result chart will change. You can still Optionally select to use Heikin Ashi
for calculations.
- When using the Heikin Ashi candles, a good buy entry is indicated by long top wick and no bottom wick
for bull (green) candles and good sell entry is indicated by long bottom wick and no top wick for
bear (red) candles.
- When the MACD histogram is flat and close to zero line,
this indicates a ranging market, do NOT trade when this occurs.
- When the PAC channel on the main chart is spread apart widely, this is an indication
of extreme volatility and choppy chart, do NOT try to trade during these periods.
A choppy chart is also indicated by Heikin Ashi candles with long wicks on both sides
of the candles.
- You can specify what strength level Alerts are generated (default 2):
Level (1) means only generate Strong Alerts only.
Level (2) means generate Strong and Medium Alerts.
Level (3) means generate Strong, Medium and Weak Alerts.

Relative Volatility Index The RVI is a modified form of the relative strength index (RSI).
The original RSI calculation separates one-day net changes into
positive closes and negative closes, then smoothes the data and
normalizes the ratio on a scale of zero to 100 as the basis for the
formula. The RVI uses the same basic formula but substitutes the
10-day standard deviation of the closing prices for either the up
close or the down close. The goal is to create an indicator that
measures the general direction of volatility. The volatility is
being measured by the 10-days standard deviation of the closing prices.

Parabolic RSI Strategy [ChartPrime × PineIndicators]This strategy combines the strengths of the Relative Strength Index (RSI) with a Parabolic SAR logic applied directly to RSI values.
Full credit to ChartPrime for the original concept and indicator, licensed under the MPL 2.0.
It provides clear momentum-based trade signals using an innovative method that tracks RSI trend reversals via a customized Parabolic SAR, enhancing traditional oscillator strategies with dynamic trend confirmation.
How It Works
The system overlays a Parabolic SAR on the RSI, detecting trend shifts in RSI itself rather than on price, offering early reversal insight with visual and algorithmic clarity.
Core Components
1. RSI-Based Trend Detection
Calculates RSI using a customizable length (default: 14).
Uses upper and lower thresholds (default: 70/30) for overbought/oversold zones.
2. Parabolic SAR Applied to RSI
A custom Parabolic SAR function tracks momentum within the RSI, not price.
This allows the system to capture RSI trend reversals more responsively.
Configurable SAR parameters: Start, Increment, and Maximum acceleration.
3. Signal Generation
Long Entry: Triggered when the SAR flips below the RSI line.
Short Entry: Triggered when the SAR flips above the RSI line.
Optional RSI filter ensures that:
Long entries only occur above a minimum RSI (e.g. 50).
Short entries only occur below a maximum RSI.
Built-in logic prevents new positions from being opened against trend without prior exit.
Trade Modes & Controls
Choose from:
Long Only
Short Only
Long & Short
Optional setting to reverse positions on opposite signal (instead of waiting for a flat close).
Visual Features
1. RSI Plotting with Thresholds
RSI is displayed in a dedicated pane with overbought/oversold fill zones.
Custom horizontal lines mark threshold boundaries.
2. Parabolic SAR Overlay on RSI
SAR dots color-coded for trend direction.
Visible only when enabled by user input.
3. Entry & Exit Markers
Diamonds: Mark entry points (above for shorts, below for longs).
Crosses: Mark exit points.
Strategy Strengths
Provides early momentum reversal entries without relying on price candles.
Combines oscillator and trend logic without repainting.
Works well in both trending and mean-reverting markets.
Easy to configure with fine-tuned filter options.
Recommended Use Cases
Intraday or swing traders who want to catch RSI-based reversals early.
Traders seeking smoother signals than price-based Parabolic SAR entries.
Users of RSI looking to reduce false positives via trend tracking.
Customization Options
RSI Length and Thresholds.
SAR Start, Increment, and Maximum values.
Trade Direction Mode (Long, Short, Both).
Optional RSI filter and reverse-on-signal settings.
SAR dot color customization.
Conclusion
The Parabolic RSI Strategy is an innovative, non-repainting momentum strategy that enhances RSI-based systems with trend-confirming logic using Parabolic SAR. By applying SAR logic to RSI values, this strategy offers early, visualized, and filtered entries and exits that adapt to market dynamics.
Credit to ChartPrime for the original methodology, published under MPL-2.0.

RSI_Heikinashi📜 Title:
Heikin-Ashi RSI Candle Plot with Multi-Timeframe Analysis and EMA Overlay
📖 Full Description:
This is an original custom indicator that transforms the traditional Relative Strength Index (RSI) into a Heikin-Ashi (HA) candle representation, allowing traders to visualize RSI trends with greater clarity, less noise, and multi-timeframe perspective.
🛠️ Core Concept and Original Method:
Rather than plotting a single RSI line, this script recalculates RSI into a Heikin-Ashi candle format, using a double EMA smoothing method on the RSI data itself.
Here's how the transformation works:
RSI Calculation:
RSI is computed traditionally using Wilder's Moving Average (RMA) for smoothing gains and losses.
The RSI period and price source are fully customizable (default length = 28, source = close).
Heikin-Ashi Style Smoothing (applied to RSI):
The HA Close is calculated as the EMA of the average between the current RSI and previous HA Close.
The HA Open is calculated as the EMA of the average between the previous HA Open and the current HA Close.
The HA High and HA Low are dynamically calculated based on the maximum/minimum values of the current RSI, HA Open, and HA Close.
Smoothing is done via 5-period EMA, which adds a unique layer of trend smoothing without traditional price-based HA calculation.
Multi-Timeframe Comparison:
In addition to plotting the chart timeframe HA RSI, the indicator retrieves the 1-hour timeframe HA RSI using request.security.
This allows traders to align trades with higher timeframe RSI trends, a powerful technique for multi-timeframe confirmation.
50 EMA Overlay:
A 50-period Exponential Moving Average (EMA) is plotted over both the chart timeframe HA RSI and the 1-hour HA RSI.
EMA acts as a trend filter or dynamic support/resistance for RSI behavior.
RSI Bands and Visual Aids:
Standard RSI bands at 70 (Overbought), 50 (Midline), and 30 (Oversold) are plotted.
A shaded background between the 30–70 levels helps highlight RSI range-bound movements versus breakout momentum.
🔥 Why this script is original and useful:
Unique Application:
This is not a simple RSI plot or standard Heikin-Ashi candle — it is a specialized smoothing method applied directly to RSI values for a clearer, noise-reduced momentum reading.
Multi-Timeframe Advantage:
Unlike typical RSI indicators, it includes a 1-hour timeframe comparison alongside the chart timeframe, improving decision-making across intraday and swing strategies.
Advanced Smoothing Logic:
Double EMA smoothing of RSI and HA-style recalculations offer a much smoother signal than traditional RSI or basic RSI/EMA crossovers.
Visualized Trend Strength:
Using colored candles instead of just a line enhances readability and gives an intuitive sense of momentum direction, strength, and possible reversals.
Fully Customizable:
Traders can adjust the RSI period and source depending on asset volatility or timeframe preferences.
📋 How to Use:
Look for HA RSI candles color changes for early momentum shifts.
Use the 50 EMA crossovers on HA RSI to confirm larger trend changes.
Compare chart timeframe vs 1H timeframe HA RSI for stronger signal alignment.
Watch for overbought/oversold breaks beyond the 70/30 bands for trade entries or exits.
⚙️ Inputs:
RSI Length (Default: 28)
RSI Source (Default: Close)
📢 Important Note:
This script is originally conceptualized and custom-built.
It is not a mashup of existing open-source indicators and introduces a new smoothing technique for RSI visualization.
🙏 Credits:
Script developed by Sri_RSI.
Fuzzy SMA with DCTI Confirmation[FibonacciFlux]FibonacciFlux: Advanced Fuzzy Logic System with Donchian Trend Confirmation
Institutional-grade trend analysis combining adaptive Fuzzy Logic with Donchian Channel Trend Intensity for superior signal quality
Conceptual Framework & Research Foundation
FibonacciFlux represents a significant advancement in quantitative technical analysis, merging two powerful analytical methodologies: normalized fuzzy logic systems and Donchian Channel Trend Intensity (DCTI). This sophisticated indicator addresses a fundamental challenge in market analysis – the inherent imprecision of trend identification in dynamic, multi-dimensional market environments.
While traditional indicators often produce simplistic binary signals, markets exist in states of continuous, graduated transition. FibonacciFlux embraces this complexity through its implementation of fuzzy set theory, enhanced by DCTI's structural trend confirmation capabilities. The result is an indicator that provides nuanced, probabilistic trend assessment with institutional-grade signal quality.
Core Technological Components
1. Advanced Fuzzy Logic System with Percentile Normalization
At the foundation of FibonacciFlux lies a comprehensive fuzzy logic system that transforms conventional technical metrics into degrees of membership in linguistic variables:
// Fuzzy triangular membership function with robust error handling
fuzzy_triangle(val, left, center, right) =>
if na(val)
0.0
float denominator1 = math.max(1e-10, center - left)
float denominator2 = math.max(1e-10, right - center)
math.max(0.0, math.min(left == center ? val <= center ? 1.0 : 0.0 : (val - left) / denominator1,
center == right ? val >= center ? 1.0 : 0.0 : (right - val) / denominator2))
The system employs percentile-based normalization for SMA deviation – a critical innovation that enables self-calibration across different assets and market regimes:
// Percentile-based normalization for adaptive calibration
raw_diff = price_src - sma_val
diff_abs_percentile = ta.percentile_linear_interpolation(math.abs(raw_diff), normLookback, percRank) + 1e-10
normalized_diff_raw = raw_diff / diff_abs_percentile
normalized_diff = useClamping ? math.max(-clampValue, math.min(clampValue, normalized_diff_raw)) : normalized_diff_raw
This normalization approach represents a significant advancement over fixed-threshold systems, allowing the indicator to automatically adapt to varying volatility environments and maintain consistent signal quality across diverse market conditions.
2. Donchian Channel Trend Intensity (DCTI) Integration
FibonacciFlux significantly enhances fuzzy logic analysis through the integration of Donchian Channel Trend Intensity (DCTI) – a sophisticated measure of trend strength based on the relationship between short-term and long-term price extremes:
// DCTI calculation for structural trend confirmation
f_dcti(src, majorPer, minorPer, sigPer) =>
H = ta.highest(high, majorPer) // Major period high
L = ta.lowest(low, majorPer) // Major period low
h = ta.highest(high, minorPer) // Minor period high
l = ta.lowest(low, minorPer) // Minor period low
float pdiv = not na(L) ? l - L : 0 // Positive divergence (low vs major low)
float ndiv = not na(H) ? H - h : 0 // Negative divergence (major high vs high)
float divisor = pdiv + ndiv
dctiValue = divisor == 0 ? 0 : 100 * ((pdiv - ndiv) / divisor) // Normalized to -100 to +100 range
sigValue = ta.ema(dctiValue, sigPer)
DCTI provides a complementary structural perspective on market trends by quantifying the relationship between short-term and long-term price extremes. This creates a multi-dimensional analysis framework that combines adaptive deviation measurement (fuzzy SMA) with channel-based trend intensity confirmation (DCTI).
Multi-Dimensional Fuzzy Input Variables
FibonacciFlux processes four distinct technical dimensions through its fuzzy system:
Normalized SMA Deviation: Measures price displacement relative to historical volatility context
Rate of Change (ROC): Captures price momentum over configurable timeframes
Relative Strength Index (RSI): Evaluates cyclical overbought/oversold conditions
Donchian Channel Trend Intensity (DCTI): Provides structural trend confirmation through channel analysis
Each dimension is processed through comprehensive fuzzy sets that transform crisp numerical values into linguistic variables:
// Normalized SMA Deviation - Self-calibrating to volatility regimes
ndiff_LP := fuzzy_triangle(normalized_diff, norm_scale * 0.3, norm_scale * 0.7, norm_scale * 1.1)
ndiff_SP := fuzzy_triangle(normalized_diff, norm_scale * 0.05, norm_scale * 0.25, norm_scale * 0.5)
ndiff_NZ := fuzzy_triangle(normalized_diff, -norm_scale * 0.1, 0.0, norm_scale * 0.1)
ndiff_SN := fuzzy_triangle(normalized_diff, -norm_scale * 0.5, -norm_scale * 0.25, -norm_scale * 0.05)
ndiff_LN := fuzzy_triangle(normalized_diff, -norm_scale * 1.1, -norm_scale * 0.7, -norm_scale * 0.3)
// DCTI - Structural trend measurement
dcti_SP := fuzzy_triangle(dcti_val, 60.0, 85.0, 101.0) // Strong Positive Trend (> ~85)
dcti_WP := fuzzy_triangle(dcti_val, 20.0, 45.0, 70.0) // Weak Positive Trend (~30-60)
dcti_Z := fuzzy_triangle(dcti_val, -30.0, 0.0, 30.0) // Near Zero / Trendless (~+/- 20)
dcti_WN := fuzzy_triangle(dcti_val, -70.0, -45.0, -20.0) // Weak Negative Trend (~-30 - -60)
dcti_SN := fuzzy_triangle(dcti_val, -101.0, -85.0, -60.0) // Strong Negative Trend (< ~-85)
Advanced Fuzzy Rule System with DCTI Confirmation
The core intelligence of FibonacciFlux lies in its sophisticated fuzzy rule system – a structured knowledge representation that encodes expert understanding of market dynamics:
// Base Trend Rules with DCTI Confirmation
cond1 = math.min(ndiff_LP, roc_HP, rsi_M)
strength_SB := math.max(strength_SB, cond1 * (dcti_SP > 0.5 ? 1.2 : dcti_Z > 0.1 ? 0.5 : 1.0))
// DCTI Override Rules - Structural trend confirmation with momentum alignment
cond14 = math.min(ndiff_NZ, roc_HP, dcti_SP)
strength_SB := math.max(strength_SB, cond14 * 0.5)
The rule system implements 15 distinct fuzzy rules that evaluate various market conditions including:
Established Trends: Strong deviations with confirming momentum and DCTI alignment
Emerging Trends: Early deviation patterns with initial momentum and DCTI confirmation
Weakening Trends: Divergent signals between deviation, momentum, and DCTI
Reversal Conditions: Counter-trend signals with DCTI confirmation
Neutral Consolidations: Minimal deviation with low momentum and neutral DCTI
A key innovation is the weighted influence of DCTI on rule activation. When strong DCTI readings align with other indicators, rule strength is amplified (up to 1.2x). Conversely, when DCTI contradicts other indicators, rule impact is reduced (as low as 0.5x). This creates a dynamic, self-adjusting system that prioritizes high-conviction signals.
Defuzzification & Signal Generation
The final step transforms fuzzy outputs into a precise trend score through center-of-gravity defuzzification:
// Defuzzification with precise floating-point handling
denominator = strength_SB + strength_WB + strength_N + strength_WBe + strength_SBe
if denominator > 1e-10
fuzzyTrendScore := (strength_SB * STRONG_BULL + strength_WB * WEAK_BULL +
strength_N * NEUTRAL + strength_WBe * WEAK_BEAR +
strength_SBe * STRONG_BEAR) / denominator
The resulting FuzzyTrendScore ranges from -1.0 (Strong Bear) to +1.0 (Strong Bull), with critical threshold zones at ±0.3 (Weak trend) and ±0.7 (Strong trend). The histogram visualization employs intuitive color-coding for immediate trend assessment.
Strategic Applications for Institutional Trading
FibonacciFlux provides substantial advantages for sophisticated trading operations:
Multi-Timeframe Signal Confirmation: Institutional-grade signal validation across multiple technical dimensions
Trend Strength Quantification: Precise measurement of trend conviction with noise filtration
Early Trend Identification: Detection of emerging trends before traditional indicators through fuzzy pattern recognition
Adaptive Market Regime Analysis: Self-calibrating analysis across varying volatility environments
Algorithmic Strategy Integration: Well-defined numerical output suitable for systematic trading frameworks
Risk Management Enhancement: Superior signal fidelity for risk exposure optimization
Customization Parameters
FibonacciFlux offers extensive customization to align with specific trading mandates and market conditions:
Fuzzy SMA Settings: Configure baseline trend identification parameters including SMA, ROC, and RSI lengths
Normalization Settings: Fine-tune the self-calibration mechanism with adjustable lookback period, percentile rank, and optional clamping
DCTI Parameters: Optimize trend structure confirmation with adjustable major/minor periods and signal smoothing
Visualization Controls: Customize display transparency for optimal chart integration
These parameters enable precise calibration for different asset classes, timeframes, and market regimes while maintaining the core analytical framework.
Implementation Notes
For optimal implementation, consider the following guidance:
Higher timeframes (4H+) benefit from increased normalization lookback (800+) for stability
Volatile assets may require adjusted clamping values (2.5-4.0) for optimal signal sensitivity
DCTI parameters should be aligned with chart timeframe (higher timeframes require increased major/minor periods)
The indicator performs exceptionally well as a trend filter for systematic trading strategies
Acknowledgments
FibonacciFlux builds upon the pioneering work of Donovan Wall in Donchian Channel Trend Intensity analysis. The normalization approach draws inspiration from percentile-based statistical techniques in quantitative finance. This indicator is shared for educational and analytical purposes under Attribution-NonCommercial-ShareAlike 4.0 International (CC BY-NC-SA 4.0) license.
Past performance does not guarantee future results. All trading involves risk. This indicator should be used as one component of a comprehensive analysis framework.
Shout out @DonovanWall

[blackcat] L2 Waveband Trading█ OVERVIEW
The Waveband Trading script calculates trading signals based on a modified Relative Strength Index (RSI)-like system combined with specific price action criteria. It plots two lines representing different smoothed RSI-like indicators and marks potential buying opportunities labeled as "S" for stronger trends and "B" for weaker but still favorable ones.
█ LOGICAL FRAMEWORK
The script begins by defining the waveband_trading_signals function which computes RSI-like metrics and determines buy signals under certain conditions. The main sections include input parameter definitions, function calls, data processing within the function, and plot commands for visual representation. Data flows from historical OHLCV data to various technical computations like EMAs and SMAs before being evaluated against user-defined thresholds to generate trade signals.
█ CUSTOM FUNCTIONS
Waveband Trading Signals:
• Purpose: Computes waveband trading signals using a customized version of the RSI indicator.
• Parameters:
— overboughtLevel: Threshold level indicating market overbought condition.
— oversoldLevel: Threshold level indicating market oversold condition.
— strongHoldLevel: Strong hold condition threshold between neutral and overbought states.
— moderateHoldLevel: Moderate hold condition threshold below strong hold level.
• [b>Returns: A tuple containing:
— k: Smoothed RSI-like metric.
— d: Further smoothed version of 'k'.
— buySignalStrong: Boolean indicating a strong trend buy signal.
— buySignalWeak: Boolean indicating a weak but promising buy signal.
█ KEY POINTS AND TECHNIQUES
• Utilizes EMA and SMA functions to smooth out price variations effectively.
• Employs crossover logic between fast ('k') and slow ('d') indicators to identify entry points.
• Incorporates volume checks ensuring increasing interest in trades aligns with upwards momentum.
• Leverages predefined threshold levels allowing flexibility to adapt to varying market conditions.
• Uses the new labeling feature ( label.new ) introduced in Pine Script v5 for marking significant chart events visually.
█ EXTENDED KNOWLEDGE AND APPLICATIONS
Potential enhancements could involve incorporating additional filters such as MACD crossovers or Fibonacci retracement levels alongside optimizing current conditions via backtesting. This technique might also prove useful in other strategies requiring robust confirmation methods beyond simple price action; alternatively, adapting it into a more automated form for execution on exchanges offering API access. Understanding key functionalities like relative strength assessment, smoothed averaging techniques, and conditional buy/sell rules enriches one’s toolkit when developing complex trading algorithms tailored specifically toward personal investment philosophies.

RSI BB StdDev SignalOverview
The RSI BB StdDev Signal Indicator is a powerful tool designed to enhance your trading strategy by combining the Relative Strength Index (RSI) with Bollinger Bands (BB). This unique combination allows traders to identify potential buy and sell signals more accurately by leveraging the strengths of both indicators. The RSI helps in identifying overbought and oversold conditions, while the Bollinger Bands provide a dynamic range to assess volatility and potential price reversals.
Key Features
— RSI Calculation: The indicator calculates the RSI based on user-defined parameters, allowing for customization to fit different trading styles.
— Bollinger Bands Integration: The RSI values are smoothed using a moving average, and Bollinger Bands are applied to this smoothed RSI to generate buy and sell signals.
— Divergence Detection: The indicator includes an optional feature to detect and alert on bullish and bearish divergences between the RSI and price action.
— Customizable Alerts: Users can set up alerts for buy and sell signals, as well as for divergences, ensuring they never miss a trading opportunity.
— Visual Aids: The indicator plots the RSI, Bollinger Bands, and signals on the chart, making it easy to visualize and interpret the data.
How It Works
1. RSI Calculation:
— The RSI is calculated using the change in the source input (default is close price) over a specified period.
— The RSI values are then plotted on the chart with customizable overbought and oversold levels.
2. Smoothing and Bollinger Bands:
— The RSI values are smoothed using a moving average (SMA, EMA, SMMA, WMA, VWMA) selected by the user.
— Bollinger Bands are applied to the smoothed RSI to create dynamic upper and lower bands.
3. Signal Generation:
—Buy signals are generated when the RSI crosses above the lower Bollinger Band.
—Sell signals are generated when the RSI crosses below the upper Bollinger Band.
—These signals are plotted on both the RSI pane and the main price chart for easy reference.
4. Divergence Detection:
— The indicator can detect and alert on regular bullish and bearish divergences between the RSI and price action.
— Bullish divergences occur when the price makes a lower low, but the RSI makes a higher low.
— Bearish divergences occur when the price makes a higher high, but the RSI makes a lower high.
Usage
1. Setting Up:
— Add the indicator to your TradingView chart.
— Customize the RSI length, source, and other parameters in the settings panel.
— Enable or disable the divergence detection based on your trading strategy.
2. Interpreting Signals:
— Use the buy and sell signals generated by the RSI crossing the Bollinger Bands as potential entry and exit points.
— Pay attention to divergences for additional confirmation of trend reversals.
3. Alerts:
— Set up alerts for buy and sell signals to receive notifications in real-time.
— Enable divergence alerts to be notified of potential trend reversals.
Conclusion
The RSI BB StdDev Signal Indicator is a comprehensive tool that combines the strengths of the RSI and Bollinger Bands to provide traders with more accurate and reliable signals. Whether you are a beginner or an experienced trader, this indicator can enhance your trading strategy by offering clear visual cues and customizable alerts.
Note
This indicator is provided with open-source code, allowing users to understand its logic and customize it further if needed. The detailed description and customizable settings ensure that traders of all levels can benefit from its unique features.

Unbound RSIUnbound RSI
Description
The Unbound RSI or de-oscillated RSI indicator is a novel technical analysis indicator that combines the concepts of the Relative Strength Index (RSI) and moving averages, applied directly over the price chart. This indicator is unique in its approach by transforming the oscillatory nature of the RSI into a format that aligns with the price action, thereby offering a distinctive view of market momentum and trends.
Key Features
Multi-Length RSI Analysis: Incorporates three different lengths of RSI (short, medium, and long), providing insights into the momentum and trend strength at various timeframes.
Deoscillation of RSI: The RSI for each length is 'deoscillated' by adjusting its scale to align with the actual price movements. This is achieved by shifting and scaling the RSI values, effectively merging them with the price line.
Average True Range (ATR) Scaling: The deoscillation process includes scaling by the Average True Range (ATR), making the indicator responsive to the asset’s volatility.
Optional Smoothing: Provides an option to apply a simple moving average (SMA) smoothing to each deoscillated RSI line, reducing noise and highlighting more significant trends.
Dynamic Moving Average (MA) Baseline: Features a moving average calculated from the medium length (default value) de-oscillated RSI, serving as a dynamic baseline to identify overarching trends.
How It’s Different
Unlike standard RSI indicators that oscillate in a fixed range, this indicator transforms the RSI to move in tandem with the price, offering a unique perspective on momentum and trend changes. The use of multiple timeframes for RSI and the inclusion of a dynamic MA baseline provide a multifaceted view of market conditions.
Potential Usage
Trend Identification: The position of the price in relation to the different deoscillated RSI lines and the MA baseline can indicate the prevailing market trend.
Momentum Shifts: Crossovers of the price with the deoscillated RSI lines or the MA baseline can signal potential shifts in momentum, offering entry or exit points.
Volatility Awareness: The ATR-based scaling of the deoscillated RSI lines means the indicator adjusts to changes in volatility, potentially offering more reliable signals in different market conditions.
Comparative Analysis: By comparing the short, medium, and long deoscillated RSI lines, traders can gauge the strength of trends and the convergence or divergence of momentum across timeframes.
Best Practices
Backtesting: Given its novel nature, it’s crucial to backtest the indicator across different assets and market conditions.
Complementary Tools: Combine with other technical analysis tools (like support/resistance levels, other oscillators, volume analysis) for more robust trading signals.
Risk Management: Always use sound risk management strategies, as no single indicator provides foolproof signals.

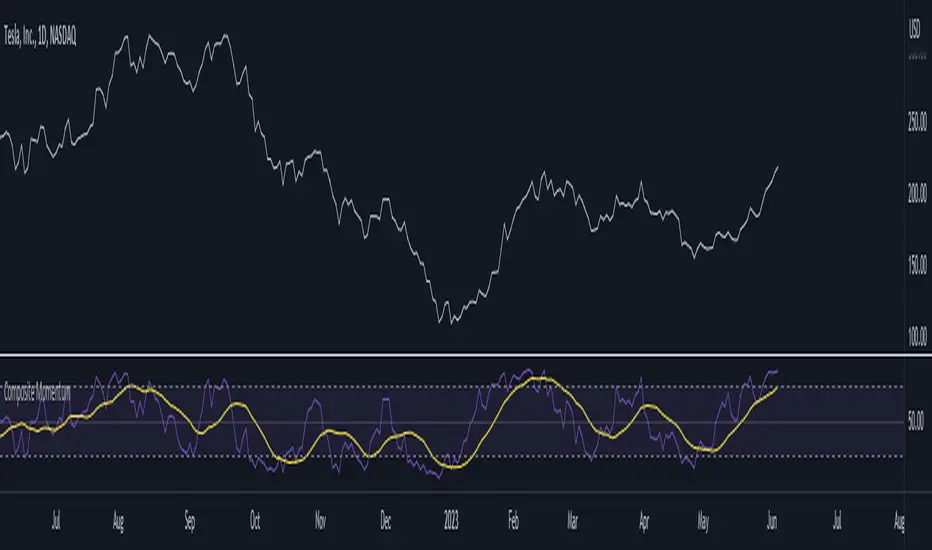
Composite MomentumComposite Momentum Indicator - Enhancing Trading Insights with RSI & Williams %R
The Composite Momentum Indicator is a powerful technical tool that combines the Relative Strength Index (RSI) and Williams %R indicators from TradingView. This unique composite indicator offers enhanced insights into market momentum and provides traders with a comprehensive perspective on price movements. By leveraging the strengths of both RSI and Williams %R, the Composite Momentum Indicator offers distinct advantages over a simple RSI calculation.
1. Comprehensive Momentum Analysis:
The Composite Momentum Indicator integrates the RSI and Williams %R indicators to provide a comprehensive analysis of market momentum. It takes into account both the strength of recent price gains and losses (RSI) and the relationship between the current closing price and the highest-high and lowest-low price range (Williams %R). By combining these two momentum indicators, traders gain a more holistic view of market conditions.
2. Increased Accuracy:
While the RSI is widely used for measuring overbought and oversold conditions, it can sometimes generate false signals in certain market environments. The Composite Momentum Indicator addresses this limitation by incorporating the Williams %R, which focuses on the price range and can offer more accurate signals in volatile market conditions. This combination enhances the accuracy of momentum analysis, allowing traders to make more informed trading decisions.
3. Improved Timing of Reversals:
One of the key advantages of the Composite Momentum Indicator is its ability to provide improved timing for trend reversals. By incorporating both RSI and Williams %R, traders can identify potential turning points more effectively. The Composite Momentum Indicator offers an early warning system for identifying overbought and oversold conditions and potential trend shifts, helping traders seize opportunities with better timing.
4. Enhanced Divergence Analysis:
Divergence analysis is a popular technique among traders, and the Composite Momentum Indicator strengthens this analysis further. By comparing the RSI and Williams %R within the composite calculation, traders can identify divergences between the two indicators more easily. Divergence between the RSI and Williams %R can signal potential trend reversals or the weakening of an existing trend, providing valuable insights for traders.
5. Customizable Moving Average:
The Composite Momentum Indicator also features a customizable moving average (MA), allowing traders to further fine-tune their analysis. By incorporating the MA, traders can smooth out the composite momentum line and identify longer-term trends. This additional layer of customization enhances the versatility of the indicator, catering to various trading styles and timeframes.
The Composite Momentum Indicator, developed using the popular TradingView indicators RSI and Williams %R, offers a powerful tool for comprehensive momentum analysis. By combining the strengths of both indicators, traders can gain deeper insights into market conditions, improve accuracy, enhance timing for reversals, and leverage divergence analysis. With the added customization of the moving average, the Composite Momentum Indicator provides traders with a versatile and effective tool to make more informed trading decisions.
MACD & RSI Overlay (Expo)█ Overview
The MACD & RSI Overlay (Expo) trading indicator is a technical analysis tool that combines two popular indicators, the Relative Strength Index (RSI ) and the Moving Average Convergence Divergence (MACD ), and overlays them onto the price chart. The indicator oscillates relative to price, so it plots the RSI and MACD around price while still displaying the same insights as the regular MACD and RSI indicators. This feature gives traders a unique perspective, allowing them to see the relationship between price, momentum, and trend in a single chart.
This indicator is a valuable addition to any trader's technical analysis toolkit, whether they are a beginner or an experienced trader.
█ MACD
█ RSI
The RSI comes with overbought and oversold areas, which can be set by the trader.
█ MACD & RSI
█ Trend Feature
What sets the MACD & RSI Overlay indicator apart is its ability to factor in the underlying trend. This feature makes the indicator more useful than ever before, as traders can use it to filter trades in the direction of the trend. By considering the underlying trend, traders can gain valuable insights into market trends.
█ Benefits
One of the primary benefits of having the MACD and RSI plotted directly on the price chart is that it provides a more intuitive understanding of the relationship between price, momentum, and trend. Traders can quickly identify the direction of the trend by observing the price movement relative to the MACD and RSI lines. In addition, by having these indicators plotted on the chart, traders can quickly identify potential buy and sell signals and develop new trading strategies.
█ How to use
One of the most popular strategies is to use the MACD & RSI Overlay indicator to look for crossings. A crossing occurs when the MACD and RSI lines cross over each other or when they cross over the signal line. These crossings can signal potential trend reversals and momentum shifts. For example, if the MACD line crosses over the signal line from below, it could indicate a bullish signal, while a cross from above could indicate a bearish signal.
-----------------
Disclaimer
The information contained in my Scripts/Indicators/Ideas/Algos/Systems does not constitute financial advice or a solicitation to buy or sell any securities of any type. I will not accept liability for any loss or damage, including without limitation any loss of profit, which may arise directly or indirectly from the use of or reliance on such information.
All investments involve risk, and the past performance of a security, industry, sector, market, financial product, trading strategy, backtest, or individual's trading does not guarantee future results or returns. Investors are fully responsible for any investment decisions they make. Such decisions should be based solely on an evaluation of their financial circumstances, investment objectives, risk tolerance, and liquidity needs.
My Scripts/Indicators/Ideas/Algos/Systems are only for educational purposes!
Bollinger Band Alert with RSI Filter IndicatorThis code is for a technical analysis indicator called Bollinger Band Alert with RSI Filter. It uses two tools: Bollinger Bands and Relative Strength Index (RSI) to identify potential trading signals in the market.
Bollinger Bands are lines plotted two standard deviations away from a simple moving average of the price of a stock or asset. They help traders determine whether prices are high or low on a relative basis.
The RSI is a momentum indicator that measures the strength of recent price changes to evaluate whether an asset is overbought or oversold.
The code has some input parameters that a user can change, such as length and multiplier, which are used to calculate the Bollinger Bands, and upper and lower RSI levels to define the overbought and oversold zones.
The code then uses if statements to generate alerts if certain conditions are met. The alert condition is triggered if the close price of an asset crosses above or below the upper or lower Bollinger Bands, and if the RSI is either above or below the overbought or oversold threshold levels.
Finally, the code generates plots to visualize the Bollinger Bands and displays triangles above or below the bars indicating when to enter a long or short position based on the strategy's criteria.

Stan Weinstein Trend IndicatorThis indicator is a trend indicator for trading charts based on the method of Stan Weinstein. It uses various technical methods to identify four trend phases on an asset: consolidation, advancement, plateauing, and decline. Users can customize the indicator by modifying parameters such as the periods for various calculations, such as the exponential moving average (EMA), the relative strength index (RSI), and support and resistance levels. The results of these calculations are then used to determine if an asset is in a phase of consolidation, advancement, plateauing, or decline.
The results are displayed as markers on the chart, with the following colors:
White: Consolidation
Green: Advancement
Blue: Plateauing
Red: Decline
According to the method of Stan Weinstein, it is recommended to buy an asset during an advancement phase and sell it during a plateauing phase. Similarly, it is recommended to sell an asset during a decline phase and cut this sale when the consolidation phase starts. It is important to note that this indicator is for informational purposes only and should not be used as investment advice. It is important to conduct fundamental and technical analysis before making an investment decision. It is also recommended to combine this analysis with other methods for optimal results and to consider the risks associated with any investment.
All default parameters of this indicator have been carefully chosen to provide the best possible results, however, it is possible to modify them according to personal preferences. It is important to note that modifying certain parameters may make the indicator less relevant and it is therefore recommended not to deviate too much from default values, unless you have a good understanding of the Stan Weinstein method and the technical indicators used.
It is important to note that this indicator is optimized for 1-week charts. It can be used to look at charts at other timeframes but calculations will always be based on weekly data.
Also, it is noteworthy that this indicator is optimized for cryptocurrencies, except Bitcoin, as it is used to calculate the relative strength of a token. However, you can choose the asset or index you want in the menu to calculate the relative strength. Furthermore, all the default settings are carefully chosen, but users are free to modify them, but doing so may result in less relevant results.

STD Aadaptive, floating RSX Dynamic Momentum Index [Loxx]STD Aadaptive, floating RSX Dynamic Momentum Index is an attempt to improve Chande's original work on Dynamic Momentum Index. The full name of this indicator is "Standard-Deviation-Adaptive, floating-level, Dynamic Momentum Index on Jurik's RSX".
What Is Dynamic Momentum Index?
The dynamic momentum index is used in technical analysis to determine if a security is overbought or oversold. This indicator, developed by Tushar Chande and Stanley Kroll, is very similar to the relative strength index (RSI). The main difference between the two is that the RSI uses a fixed number of time periods (usually 14), while the dynamic momentum index uses different time periods as volatility changes, typically between five and 30.
What is RSX?
RSI is a very popular technical indicator, because it takes into consideration market speed, direction and trend uniformity. However, the its widely criticized drawback is its noisy (jittery) appearance. The Jurk RSX retains all the useful features of RSI, but with one important exception: the noise is gone with no added lag.
Differences
RSX is used instead of RSI for the calculation, producing a much smoother result
Standard deviation is used to adapt the RSX calculation
Floating levels are used instead of fixed levels for OB/OS
Included
-Change bar colors

Coppock Curve with Pivot Points and Divergence The Coppock Curve is a long-term price momentum indicator used primarily to recognize major downturns and upturns in a stock market index. It is calculated as a 10-month weighted moving average of the sum of the 14-month rate of change and the 11-month rate of change for the index. It is also known as the "Coppock Guide."
The Coppock formula was introduced in Barron's in 1962 by Edwin Coppock.
The Coppock Curve is a technical indicator that provides long-term buy and sell signals for major stock indexes and related ETFs based on shifts in momentum.
What Does the Coppock Curve Tell You?
The Coppock Curve was originally implemented as a long-term buy and sell indicator for major indices such as the S&P 500 and the Wilshire 5000. Often, it is used with long-term time series such as a candlestick chart, but where each candle contains a month's worth of price information.
The Difference Between the Coppock Curve and Rate of Relative Strength Index (RSI)?
The relative strength index looks at how the current price compares to prior prices, though it is calculated differently than the rate of change (ROC) indicator used in the Coppock Curve calculation. Therefore, these indicators will provide different trade signals and information.
What are those circles?
-These are Divergences. Red for Regular-Bearish. Orange for Hidden-Bearish. Green for Regular-Bullish. Aqua for Hidden-Bullish.
What are those triangles?
- These are Pivots . They show when the VPT oscillator might reverse, this is important to know because many times the price action follows this move.
Please keep in mind that this indicator is a tool and not a strategy, do not blindly trade signals, do your own research first! Use this indicator in conjunction with other indicators to get multiple confirmations.

Best Currency Strength Indicator By Mahfuz AzimBest Currency Strength Indicator is a visual guide that demonstrates which currencies are currently strong, and which ones are weak.
FX Currency strength indicators include multiple calculation to choose from
1. Relative Strength Index ( RSI )
2. True Strength Index (TSI)
3. Absolute Strength Index (ASI)
4. Linear Regression Slope ( LRS )
5. Rate of Change ( ROC ) and
6. Z-Score

FX Currency Strength IndicatorFX Currency strength indicator is a visual guide that demonstrates which currencies are currently strong, and which ones are weak.
FX Currency strength indicators include multiple calculation to choose from
1. Relative Strength Index (RSI)
2. True Strength Index (TSI)
3. Absolute Strength Index (ASI)
4. Linear Regression Slope (LRS)
5. Rate of Change (ROC)
6. Z-Score
Three display modes
1. Lines
2. Columns
3. Areas

TRI - Multi-Timeframe BIASTRI - MULTI-TIMEFRAME BIAS INDICATOR
DESCRIPTION:
Advanced multi-timeframe bias indicator that analyzes market sentiment across
5 different timeframes (15m, 1h, 4h, 1d, 1w) using adaptive technical analysis.
Provides clear directional bias signals to help determine market momentum.
KEY FEATURES:
ADAPTIVE PARAMETERS: Uses different EMA lengths and weights for each timeframe
EMA TREND ANALYSIS: Fast/slow EMA crossovers with slope analysis for momentum
RSI MOMENTUM: Adaptive overbought/oversold levels based on timeframe
ADX STRENGTH: Directional movement confirmation with DI+/DI- analysis
COMPOSITE SCORING: Weighted combination of trend, momentum, and strength
TIMEFRAME ANALYSIS:
15m: EMA9/21 + High momentum weight (45%) - Ultra-responsive for scalping
1h: EMA21/50 + Medium momentum weight (35%) - Balanced for day trading
4h: EMA50/200 + Lower momentum weight (25%) - Swing trading focus
1d: EMA50/200 + Trend focused (55%) - Position trading signals
1w: EMA50/200 + Maximum trend weight (60%) - Long-term bias
BIAS SIGNALS:
STRONG BULLISH/BEARISH: Score ≥ 0.5 - Very strong directional momentum
BULLISH/BEARISH: Score ≥ 0.25 - Clear directional signals
WEAK BULLISH/BEARISH: Score ≥ 0.1 - Mild directional bias
NEUTRAL: Score < 0.1 - No clear directional preference
ALERTS:
Major Bullish/Bearish: When 4H and 1D timeframes align
High confidence signals for strategic decision making
USAGE:
Higher timeframes (1d, 1w) show primary market direction
Lower timeframes (15m, 1h) provide entry timing
Look for alignment across multiple timeframes for stronger signals
Use confidence levels to assess signal reliability
TECHNICAL COMPONENTS:
Exponential Moving Averages (EMA) for responsive trend detection
Relative Strength Index (RSI) for momentum analysis
Average Directional Index (ADX) with DI+/DI- for trend strength
Volume ratio confirmation for signal validation
Adaptive thresholds optimized for each timeframe's characteristics
